Measuring what a workshop draws when nothing is running
A monthly bill gives a total, never a culprit. Metering machine by machine changes the question: what does the site draw on a Sunday, and why?
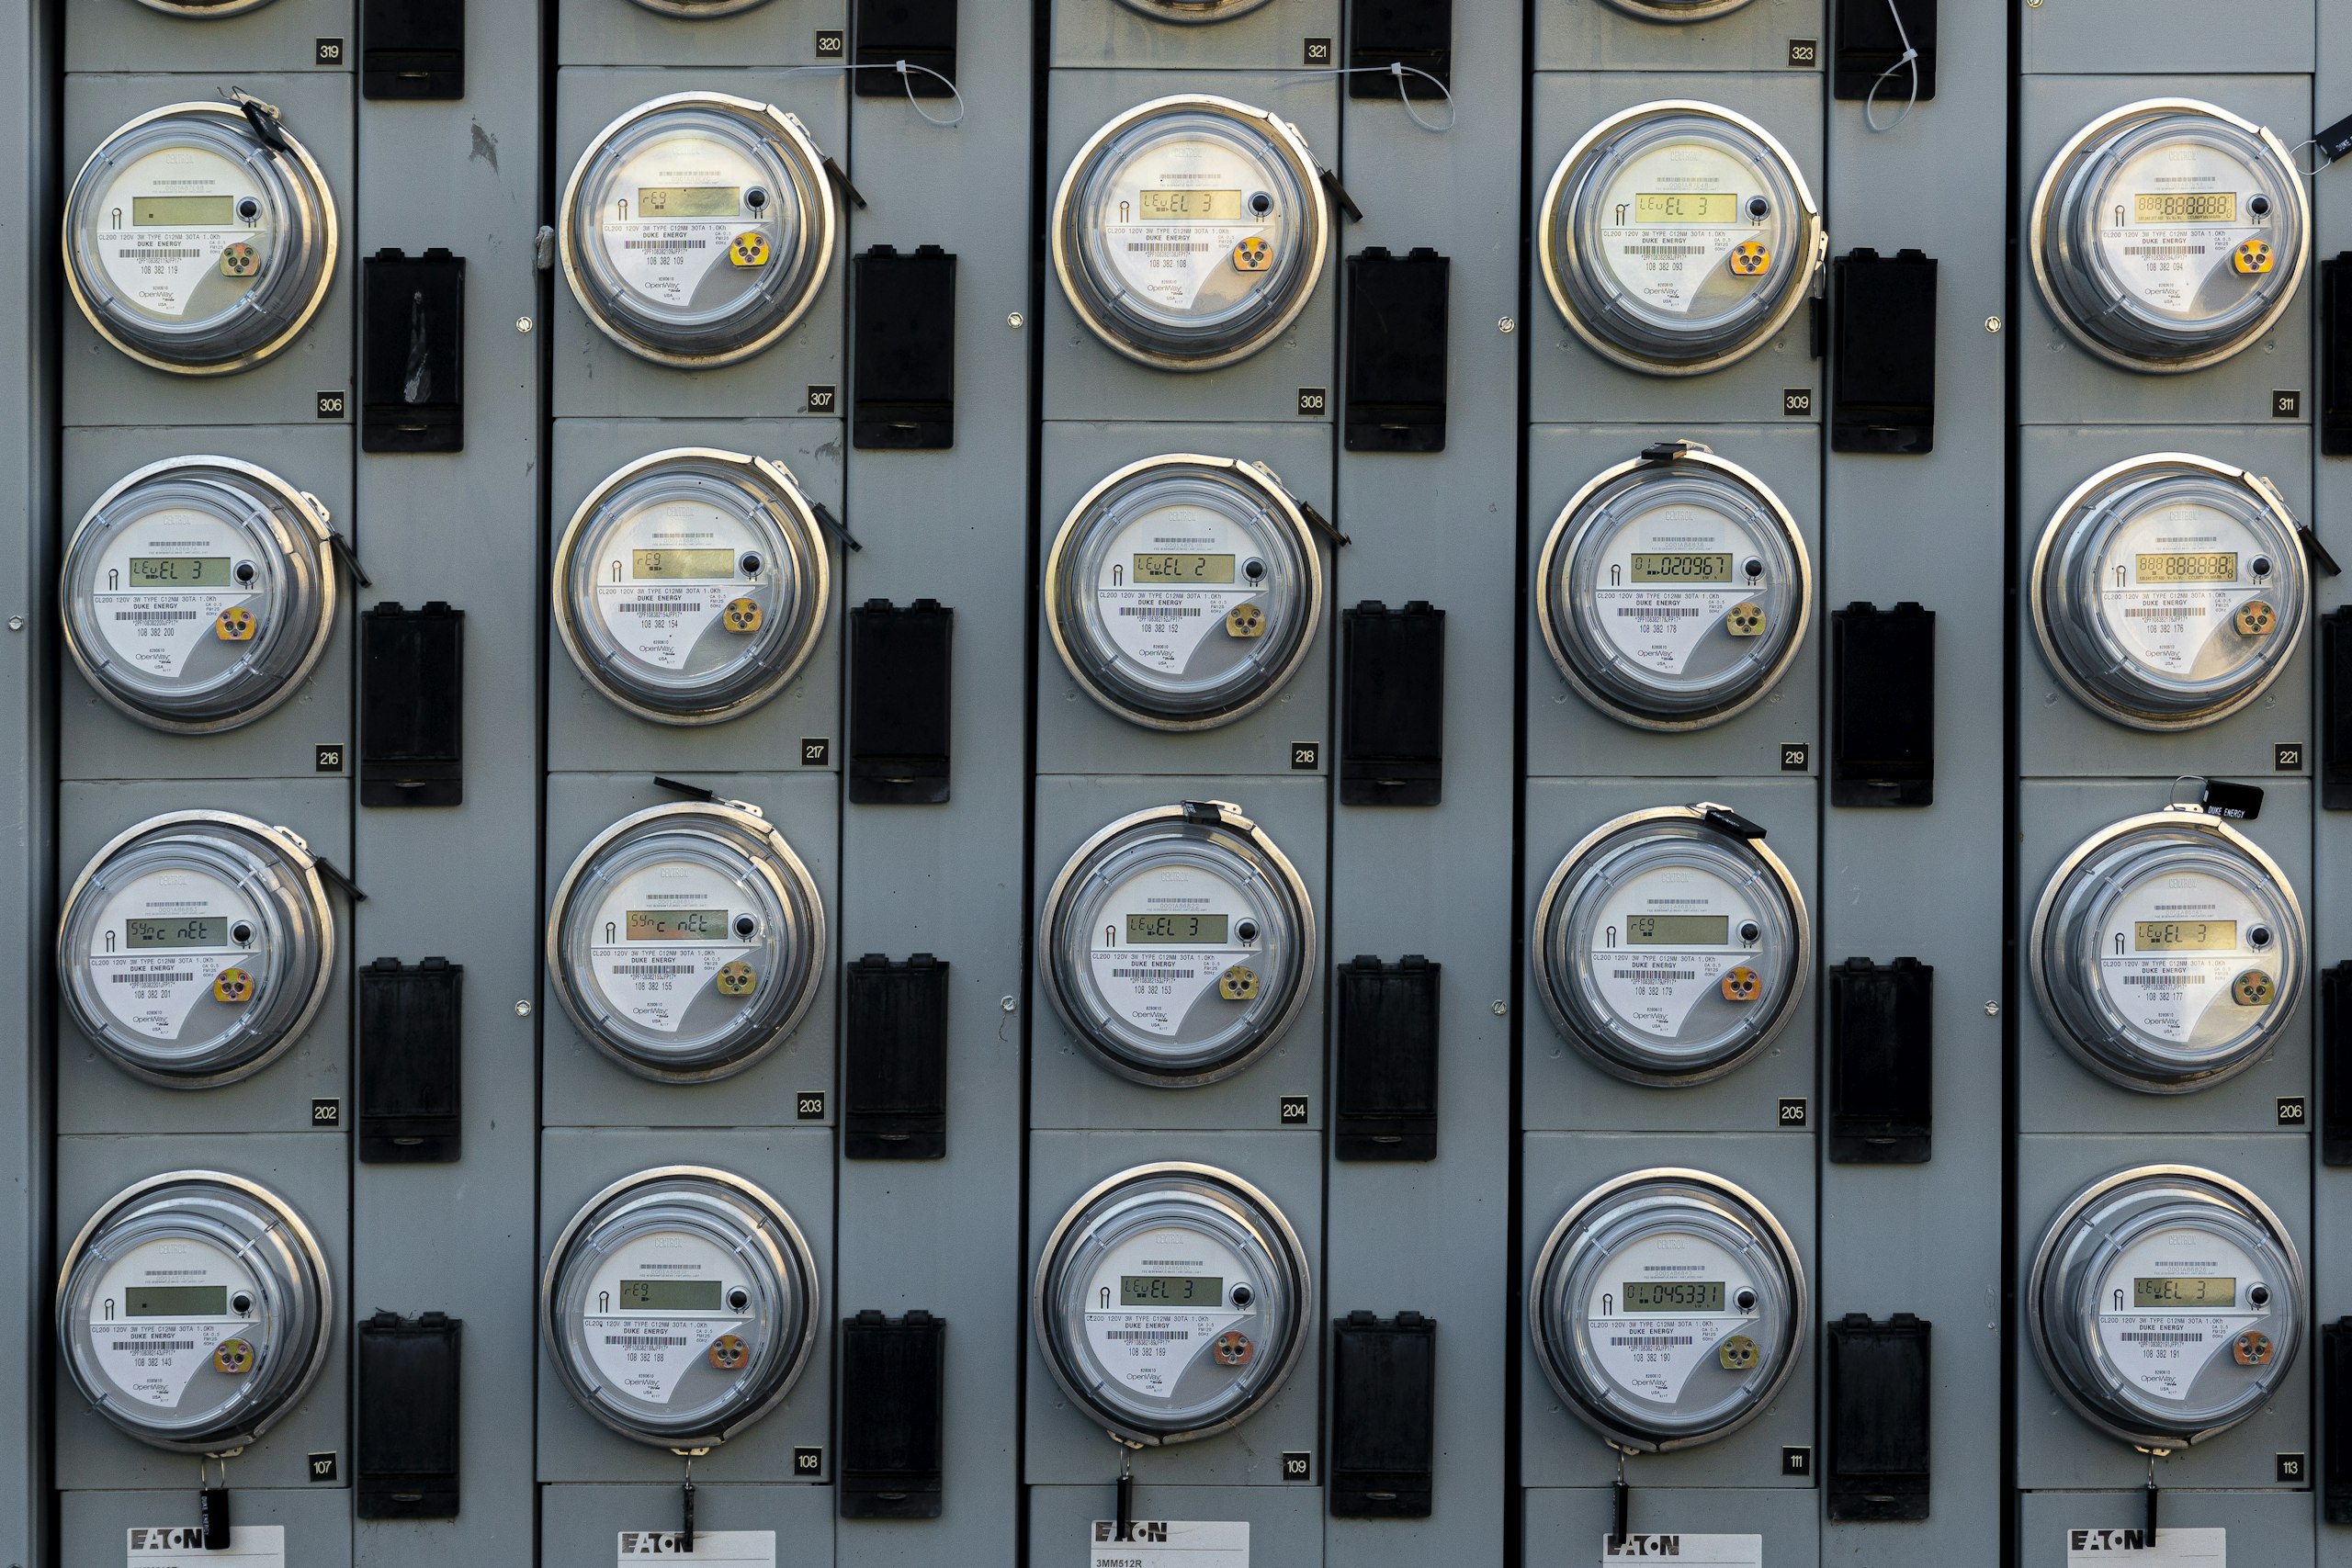
Photo: Jon Moore / Unsplash, Licence Unsplash
There is one figure almost no industrial site holds and almost every site could obtain within a week: what a workshop draws when it is stopped. Not the average, not the monthly total: the reading at four in the morning on a Sunday, when nothing is being made.
The baseload shows what the bill hides
That floor has a name: the baseload. It gathers everything that runs without making anything, from auxiliaries never switched off to equipment left energised out of habit.
A single bill cannot show it, because it adds everything up. Metering machine by machine exposes it immediately, and allows two things a bill never will: raising an alert when a piece of equipment drifts, and relating consumption to output volume to obtain the real cost of a part.
Where the measurement goes
The chain is short. A current clamp clips onto the conductor without breaking the circuit and measures up to 500 amps. It connects to the Syway, a remote sensor that samples once per second and communicates over Bluetooth Low Energy. The Syway talks to the Sybox, which carries the LTE-M link and sends everything on.
Nothing to run, nothing to drill, nothing to ask of the IT department: the Sybox holds no address on the plant network and takes up no room on it. That isolation by design is what makes installation possible without a security review, and the product is built towards the Cyber Resilience Act.
A current drift is also a symptom
A motor under strain draws more before it fails. Which is why energy data does not concern only the energy manager: the same curve serves two trades.
By cross-checking the electrical reading against the vibration and ambient data collected by the Sybox, Sycon's algorithms look for anomalies that neither curve reveals on its own. Submetering then becomes a way into predictive maintenance, at a far lower entry cost than a full instrumentation project.
What you do with it next
History is available on a real-time dashboard, machine by machine. Sites that are already tooled up (ERP, CMMS, supervision) pull the same streams through an API and fold them into what they already use.
So the question worth asking before you start is not how many machines to fit, but what decision you will take on the day the curve is in front of you.