Making an energy saving provable on an industrial site
Energy efficiency projects rarely fail on the engineering. They fail when nobody can prove that the saving announced actually happened.
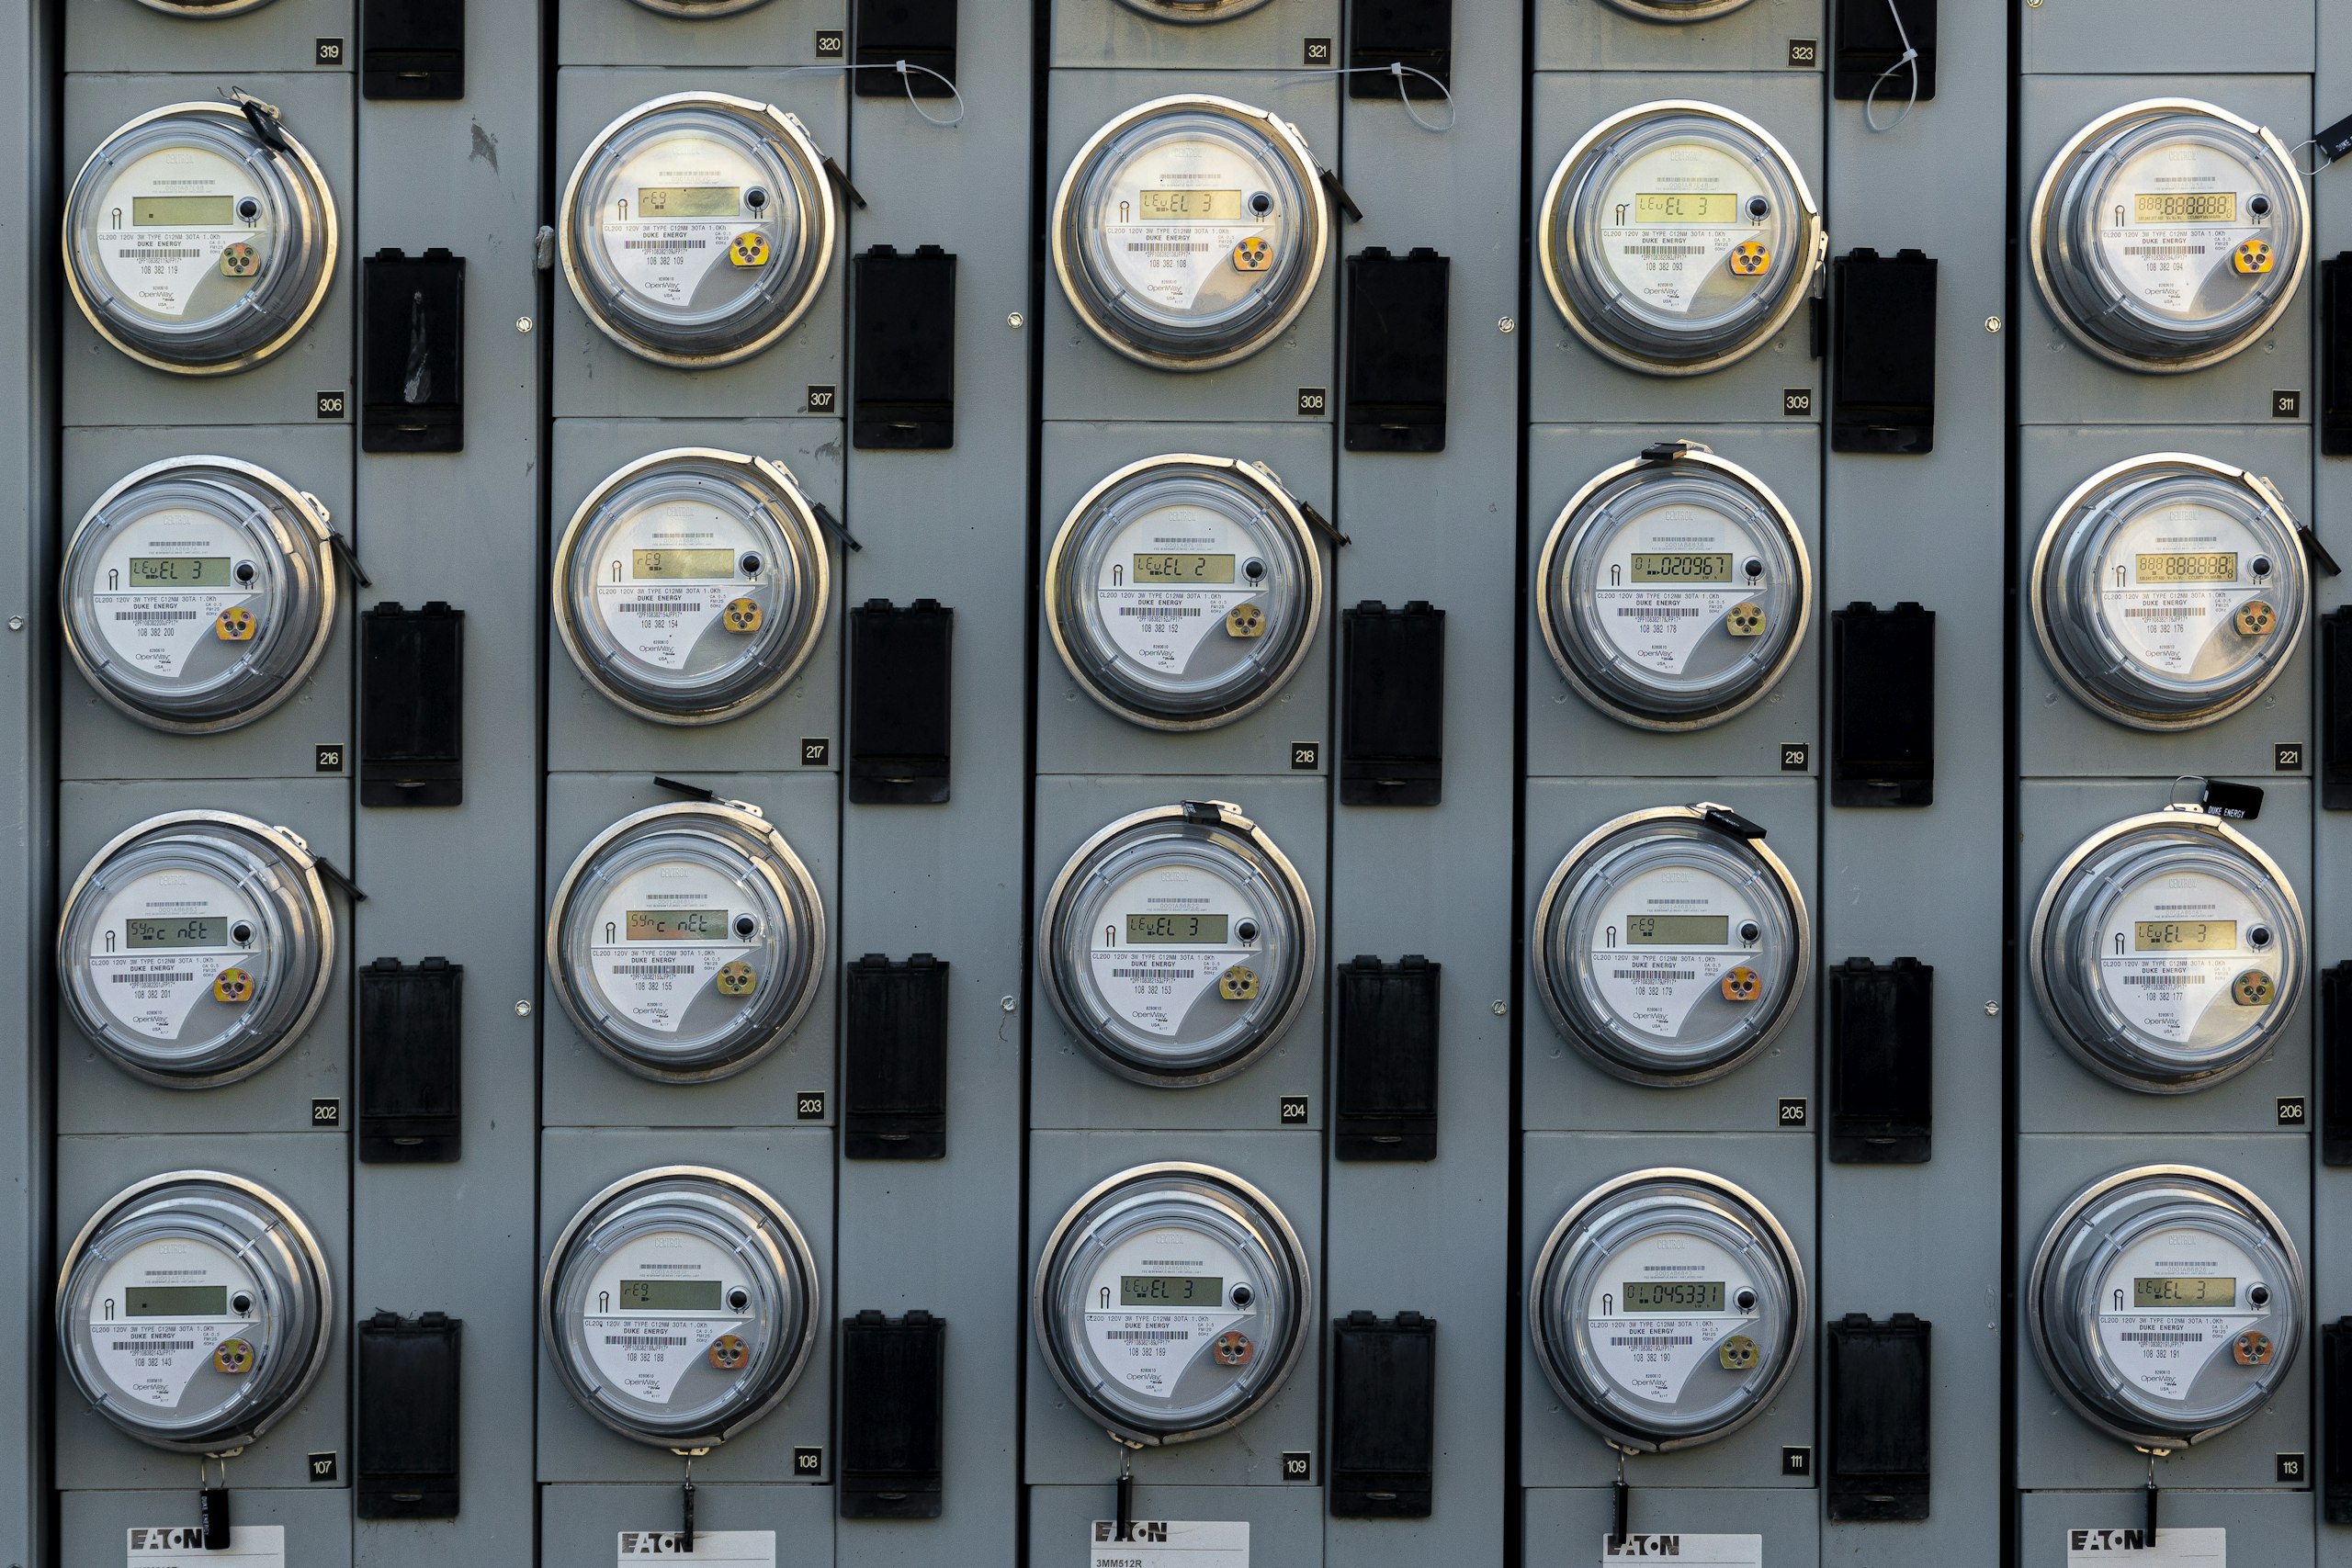
Photo: Jon Moore / Unsplash, Licence Unsplash
A site fixes leaks, adjusts network pressure, replaces a motor. Three months later the bill has fallen, or it has not. Either way the discussion bogs down, because output, shift patterns, weather and product mix have all moved too. From the same figures, two opposite conclusions can be argued.
The objections you will face
They are always the same, and they are legitimate:
- output volume was not the same
- shift patterns or organisation changed
- the season explains the gap: heating, cooling, humidity
- several actions ran in parallel, so attribution becomes impossible
- the reference period was atypical: commissioning, an extended shutdown, an exceptional run
None of these objections can be refuted after the fact. They are neutralised beforehand, by writing the rules down.
Four decisions to write before acting
That is what a measurement and verification plan is for: the M&V approach, framed by ISO 50015 for verification principles and ISO 50006 for indicators and baselines.
- The boundary: what is included and what is excluded. One machine, one line, a utility such as compressed air, or the whole site. A vague boundary produces savings nobody can attribute.
- The baseline: the "before" period, long enough to be representative, and the model that describes it.
- The indicator: consumption related to a level of activity, in kWh per tonne, per running hour or per batch. It has to stay legible to production and to management alike.
- The influencing factors and adjustment rules: volume, weather, shift patterns, scrap rate. The method does not erase them, it documents them.
The decisive point is timing. These rules are set before the results appear; set afterwards, they become opportunistic adjustments, and the objection comes back in through the window.
Sizing the measurement effort
The IPMVP protocol describes four options, differing only in how deeply you instrument. Option A measures the key parameters and estimates the rest: quick, but sensitive to assumptions. Option B measures all significant parameters at the level of the system concerned: in industry, usually the right compromise. Option C works from site meters, relevant when the action matters at that scale. Option D rests on a calibrated simulation, reserved for the cases that justify it.
The choice depends less on budget than on how much challenge you expect: internal steering, a grant application, a performance contract.
One case: compressed air
Action: leak reduction and adjustment of network pressure. Option B, boundary limited to the compressors and the main network. Measurements: compressor electricity, running hours, pressure. Baseline: several weeks before the action. Indicator: kWh per production hour. After the action, the same rules, a comparable period, and a note listing the operating changes observed.
The deliverable runs to a few pages: boundary, chosen option, baseline, indicator, data quality, adjustments applied, limits. It is that short document, written early, that heads off most of the disagreement.